
The digital twin of your furnace.
FurnIQ captures inspections, wall-thickness measurements and refractory data on an exact drawing of your installation. Click any zone, pipe or grate — and see the full history and current condition.
FurnIQ · Refractory walls — condition per tile (demo)
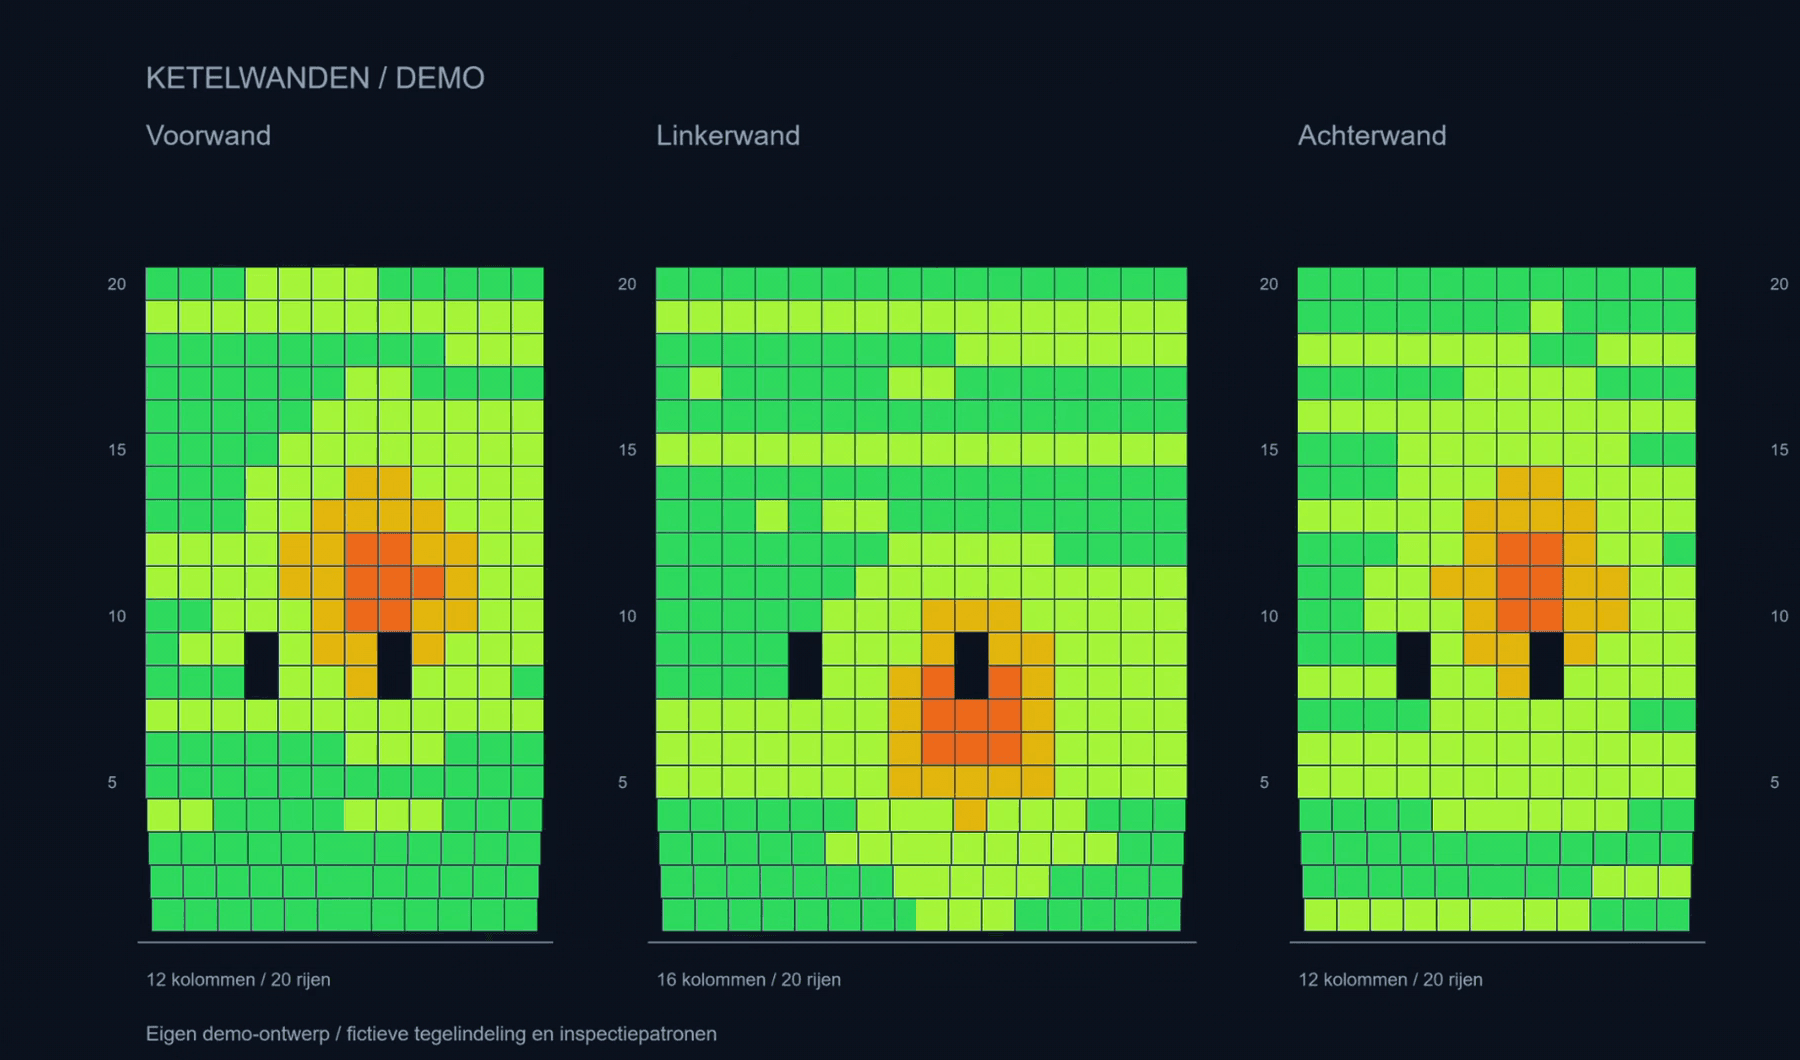
Your furnace, clickable zone by zone.
No more separate spreadsheets per inspection: FurnIQ puts your combustion line on a clickable cross-section, with a map of its own for the grate, the refractory walls, the superheater and the economiser. Choose a view — condition, follow-up points, age or measured wall thickness — and the map is coloured accordingly.
A map per component, drawn to your installation
Clickable grate positions, refractory plates and tubes
Views on condition, follow-up points, age and wall thickness
Every inspection numbered, every measurement in the right place.
An inspection gets a number of its own and a folder with overview, components, follow-up, files and history. What you record sits on the element it belongs to. When you complete the inspection, a summary is kept per component — and afterwards you view every map as it is now, or as it was at an earlier outage.
- Wall thickness per tube and measuring height in superheater and economiser, checked against your own nominal, Tmin and class limits
- Condition, damage and photos per grate position or refractory plate
- Compare outages, or show only the findings of this inspection
- Corrections with a reason; the original value is kept
How fast is the wall wearing?
As soon as a bundle has been measured in at least two outages, FurnIQ calculates the wear per measuring point in millimetres per year: a straight line through the measurements since the last replacement. Extended to your own Tmin, that gives a projection of the remaining life, shown per bundle next to the wear you expected.
- Wear per measuring point in mm per year, with the largest wall loss on top
- Per measuring point the year in which Tmin or a class limit is reached at the current trend
- Remaining life per bundle: expected against measured wear
- The trend across outages, and the history per outage
The projection extends the trend of your own measurements. Every new outage gives it a firmer basis.
Trend across outages
Economiser · bundle 2 · tube 14 · windward side
Remaining life per bundle
expected vs measured wear · projected to Tmin
- 2037 · in 11 years
Bundle 1
Expected 0.15 mm/year · Measured 0.11 mm/year
- 2029 · in 3 years
Bundle 2
Expected 0.15 mm/year · Measured 0.20 mm/year
- 2033 · in 7 years
Bundle 3
Expected 0.15 mm/year · Measured 0.14 mm/year
From finding to maintenance, without retyping.
Whatever needs attention, you record as a follow-up point: with a severity from 1 to 5, attachments and the elements on the map it concerns. From the follow-up point you raise a notification in Maintenance, or link an existing notification or work order. Its status simply shows up in FurnIQ.
- 1Finding on the map
- 2Follow-up point
- 3Notification in Maintenance
- 4Work order
- Numbered follow-up points with severity and status: open, resolved or dismissed
- Show on map: see at once which positions or plates it concerns
- Raise a notification or link existing work, with its status live alongside
Know when which grate was replaced.
Every replacement is recorded with date, type, reason and who did it — one at a time, or for a whole selection at once. Per outage the map shows what was replaced and why, and per element the full history. So you plan an overhaul on condition instead of gut feeling.
Replacements per outage, coloured by reason
Age since the last replacement, next to the expected life per block type
Block types carrying the article number from your warehouse
The contractor's data, checked on the map first.
Contractors deliver their data in a fixed format. When you read it in, you first see the result on the map, with warnings and errors per line. Only after your confirmation is everything saved in one go — or nothing.
Bundles
Wall-thickness measurements in a protected Excel workbook with a tab per tube row. Every value stays traceable to file, sheet and cell.
Grate
Replacements in an Excel grid laid out like the grate: the contractor marks every replaced cell, you choose the reason.
Refractory walls
A fill-in map as a standalone file, which the contractor completes offline in the browser and sends back.
Built for refractory environments.
FurnIQ is one example of how TimeQeeper complements generic EAM with vertical modules for specific industries.
Further reading on this topic
Ready for more control over your maintenance?
Book a tailored demo. We'll show how TimeQeeper fits your assets, processes and team — and we'll get in touch quickly.