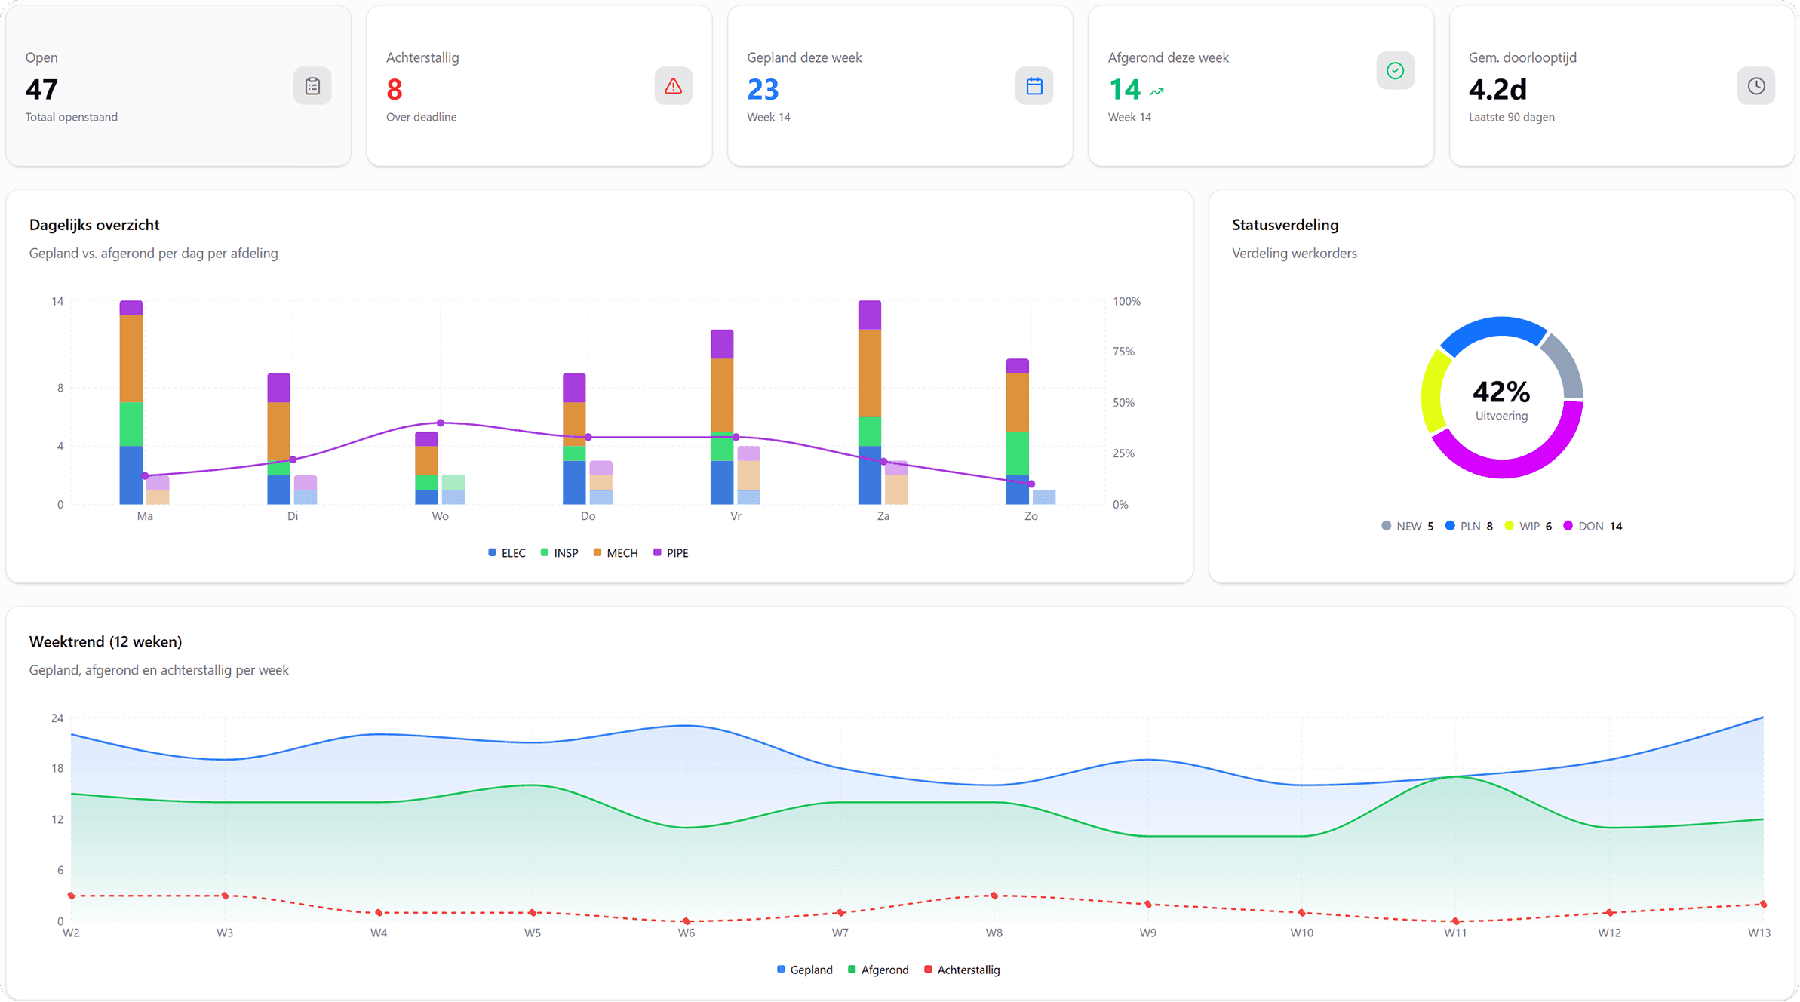
Build your own KPI dashboard.
Drag widgets onto a grid, pick your data sources — from work orders and run-hours to warehouse and shift logs — and share the result with your team. No BI consultant needed.
Add widget
- KPI
- Bar chart
- Line chart
- Gauge
- Heatmap
- Table
Open work orders
47
-3 vs last week
Availability
Work orders per department
Drag a widget here
Drag, drop, done.
Every user builds their own dashboards on a responsive grid: drag widgets, resize them, and keep multiple dashboards side by side — for example one for maintenance and one for the warehouse.
Drag-and-drop with clean grid alignment
Multiple dashboards per user
Light and dark theme
Works on desktop, tablet and mobile
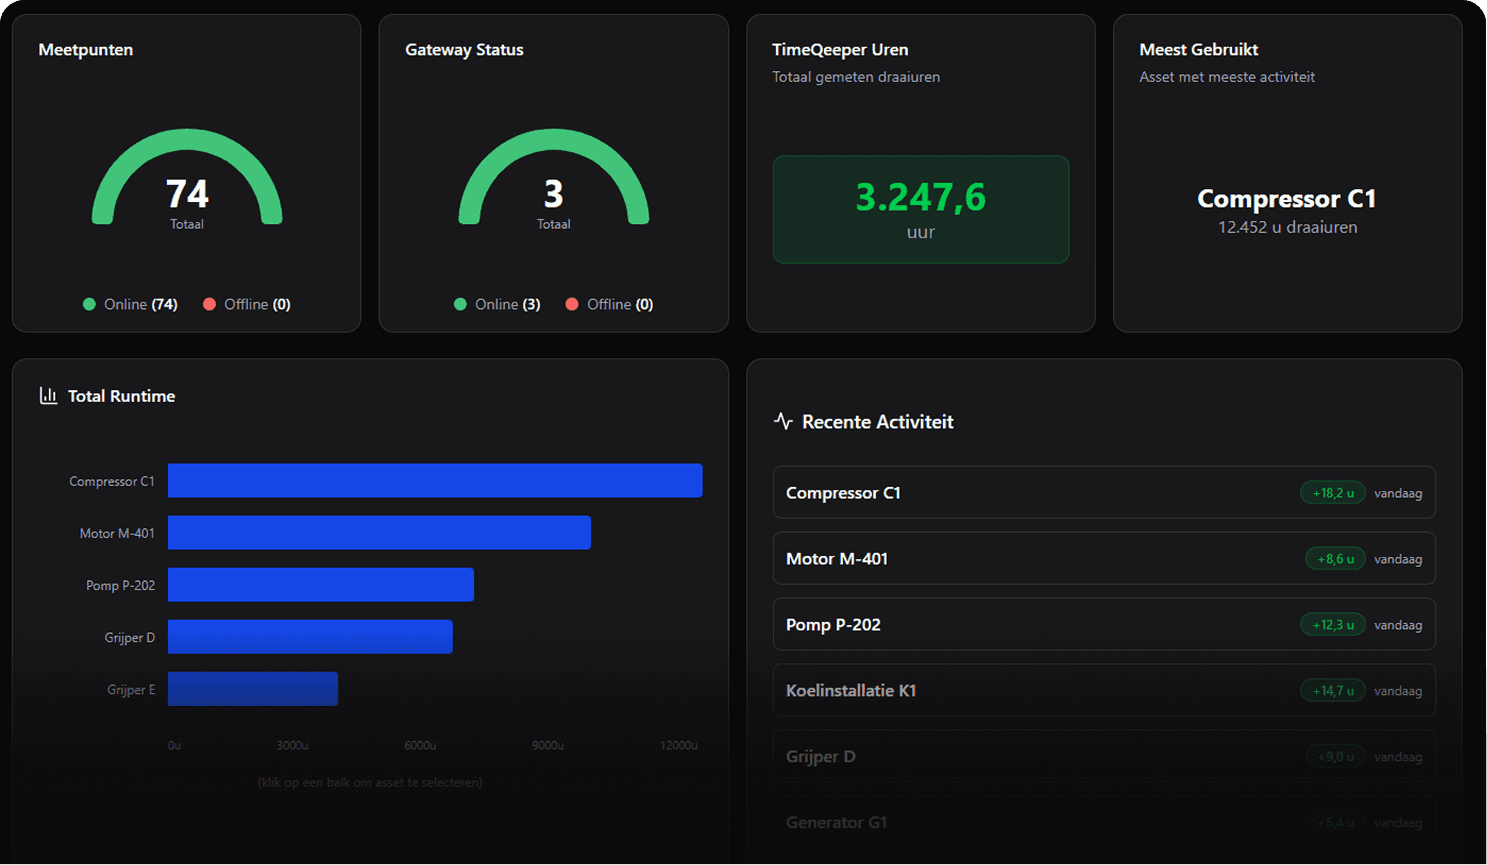
Twenty-plus widget types, all your platform data.
From KPI tiles and gauges with threshold colours to heatmaps, sankey and calendar charts. Every widget shows live platform data — and respects your permissions: you only see sources you have access to.
- KPIs, gauges, bar, line and pie charts, heatmaps and tables
- Sources: assets, work orders, notifications, warehouse, run-hours, permits and shift logs
- Per-widget filters with and/or logic
- Add your own data via Excel or CSV import
Share dashboards with your team.
Publish a dashboard and colleagues adopt it as their own copy — layout and widgets included. Permissions stay in charge: everyone only sees the data they have access to.
- Publish and adopt with one click
- Own copy: everyone arranges their dashboard themselves
- Role-based access governs the data, not the widget
Ready for more control over your maintenance?
Book a tailored demo. We'll show how TimeQeeper fits your assets, processes and team — and we'll get in touch quickly.